import os
os.environ['TF_CPP_MIN_LOG_LEVEL'] = '3'  # 设置日志级别为ERROR,以减少警告信息
# 禁用 Gemini 的底层库(gRPC 和 Abseil)在初始化日志警告
os.environ["GRPC_VERBOSITY"] = "ERROR"
os.environ["GLOG_minloglevel"] = "3"  # 0: INFO, 1: WARNING, 2: ERROR, 3: FATAL
os.environ["GLOG_minloglevel"] = "true"
import logging
import tensorflow as tf
tf.get_logger().setLevel(logging.ERROR)
tf.compat.v1.logging.set_verbosity(tf.compat.v1.logging.ERROR)
!export TF_FORCE_GPU_ALLOW_GROWTH=true
# Copyright 2018 The TensorFlow Authors.
#@title Licensed under the Apache License, Version 2.0 (the "License");
# you may not use this file except in compliance with the License.
# You may obtain a copy of the License at
#
# https://www.apache.org/licenses/LICENSE-2.0
#
# Unless required by applicable law or agreed to in writing, software
# distributed under the License is distributed on an "AS IS" BASIS,
# WITHOUT WARRANTIES OR CONDITIONS OF ANY KIND, either express or implied.
# See the License for the specific language governing permissions and
# limitations under the License.
#@title MIT License
#
# Copyright (c) 2017 François Chollet
#
# Permission is hereby granted, free of charge, to any person obtaining a
# copy of this software and associated documentation files (the "Software"),
# to deal in the Software without restriction, including without limitation
# the rights to use, copy, modify, merge, publish, distribute, sublicense,
# and/or sell copies of the Software, and to permit persons to whom the
# Software is furnished to do so, subject to the following conditions:
#
# The above copyright notice and this permission notice shall be included in
# all copies or substantial portions of the Software.
#
# THE SOFTWARE IS PROVIDED "AS IS", WITHOUT WARRANTY OF ANY KIND, EXPRESS OR
# IMPLIED, INCLUDING BUT NOT LIMITED TO THE WARRANTIES OF MERCHANTABILITY,
# FITNESS FOR A PARTICULAR PURPOSE AND NONINFRINGEMENT. IN NO EVENT SHALL
# THE AUTHORS OR COPYRIGHT HOLDERS BE LIABLE FOR ANY CLAIM, DAMAGES OR OTHER
# LIABILITY, WHETHER IN AN ACTION OF CONTRACT, TORT OR OTHERWISE, ARISING
# FROM, OUT OF OR IN CONNECTION WITH THE SOFTWARE OR THE USE OR OTHER
# DEALINGS IN THE SOFTWARE.
基本分类:对服装图像进行分类#
 在 TensorFlow.org 上查看 在 TensorFlow.org 上查看 |
 在 Google Colab 中运行 在 Google Colab 中运行 |
 在 GitHub 上查看源代码 在 GitHub 上查看源代码 |
 下载笔记本 下载笔记本 |
本指南将训练一个神经网络模型,对运动鞋和衬衫等服装图像进行分类。即使您不理解所有细节也没关系;这只是对完整 TensorFlow 程序的快速概述,详细内容会在您实际操作的同时进行介绍。
本指南使用了 tf.keras,它是 TensorFlow 中用来构建和训练模型的高级 API。
# TensorFlow and tf.keras
import tensorflow as tf

# Helper libraries
import numpy as np
import matplotlib.pyplot as plt

print(tf.__version__)
2.17.0
导入 Fashion MNIST 数据集#
本指南使用 Fashion MNIST 数据集,该数据集包含 10 个类别的 70,000 个灰度图像。这些图像以低分辨率(28x28 像素)展示了单件衣物,如下所示:
| |
| 图 1. Fashion-MNIST 样本(由 Zalando 提供,MIT 许可)。 |
Fashion MNIST 旨在临时替代经典 MNIST 数据集,后者常被用作计算机视觉机器学习程序的“Hello, World”。MNIST 数据集包含手写数字(0、1、2 等)的图像,其格式与您将使用的衣物图像的格式相同。
本指南使用 Fashion MNIST 来实现多样化,因为它比常规 MNIST 更具挑战性。这两个数据集都相对较小,都用于验证某个算法是否按预期工作。对于代码的测试和调试,它们都是很好的起点。
在本指南中,我们使用 60,000 张图像来训练网络,使用 10,000 张图像来评估网络学习对图像进行分类的准确程度。您可以直接从 TensorFlow 中访问 Fashion MNIST。直接从 TensorFlow 中导入和加载 Fashion MNIST 数据:
fashion_mnist = tf.keras.datasets.fashion_mnist

(train_images, train_labels), (test_images, test_labels) = fashion_mnist.load_data()
加载数据集会返回四个 NumPy 数组:
train_images和train_labels数组是训练集,即模型用于学习的数据。测试集、
test_images和test_labels数组会被用来对模型进行测试。
图像是 28x28 的 NumPy 数组,像素值介于 0 到 255 之间。标签是整数数组,介于 0 到 9 之间。这些标签对应于图像所代表的服装类:
| 标签 | 类 |
|---|---|
| 0 | T恤/上衣 |
| 1 | 裤子 |
| 2 | 套头衫 |
| 3 | 连衣裙 |
| 4 | 外套 |
| 5 | 凉鞋 |
| 6 | 衬衫 |
| 7 | 运动鞋 |
| 8 | 包 |
| 9 | 短靴 |
每个图像都会被映射到一个标签。由于数据集不包括类名称,请将它们存储在下方,供稍后绘制图像时使用:
class_names = ['T-shirt/top', 'Trouser', 'Pullover', 'Dress', 'Coat',
               'Sandal', 'Shirt', 'Sneaker', 'Bag', 'Ankle boot']
浏览数据#
在训练模型之前,我们先浏览一下数据集的格式。以下代码显示训练集中有 60,000 个图像,每个图像由 28 x 28 的像素表示:
train_images.shape
(60000, 28, 28)
同样,训练集中有 60,000 个标签:
len(train_labels)
60000
每个标签都是一个 0 到 9 之间的整数:
train_labels
array([9, 0, 0, ..., 3, 0, 5], dtype=uint8)
测试集中有 10,000 个图像。同样,每个图像都由 28x28 个像素表示:
test_images.shape
(10000, 28, 28)
测试集包含 10,000 个图像标签:
len(test_labels)
10000
预处理数据#
在训练网络之前,必须对数据进行预处理。如果您检查训练集中的第一个图像,您会看到像素值处于 0 到 255 之间:
plt.figure()
plt.imshow(train_images[0])
plt.colorbar()
plt.grid(False)
plt.show()
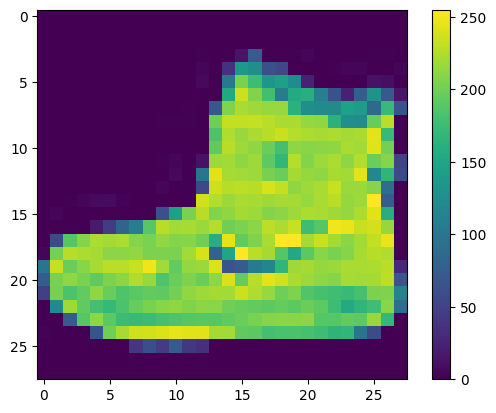
将这些值缩小至 0 到 1 之间,然后将其馈送到神经网络模型。为此,请将这些值除以 255。请务必以相同的方式对训练集和测试集进行预处理:
train_images = train_images / 255.0

test_images = test_images / 255.0
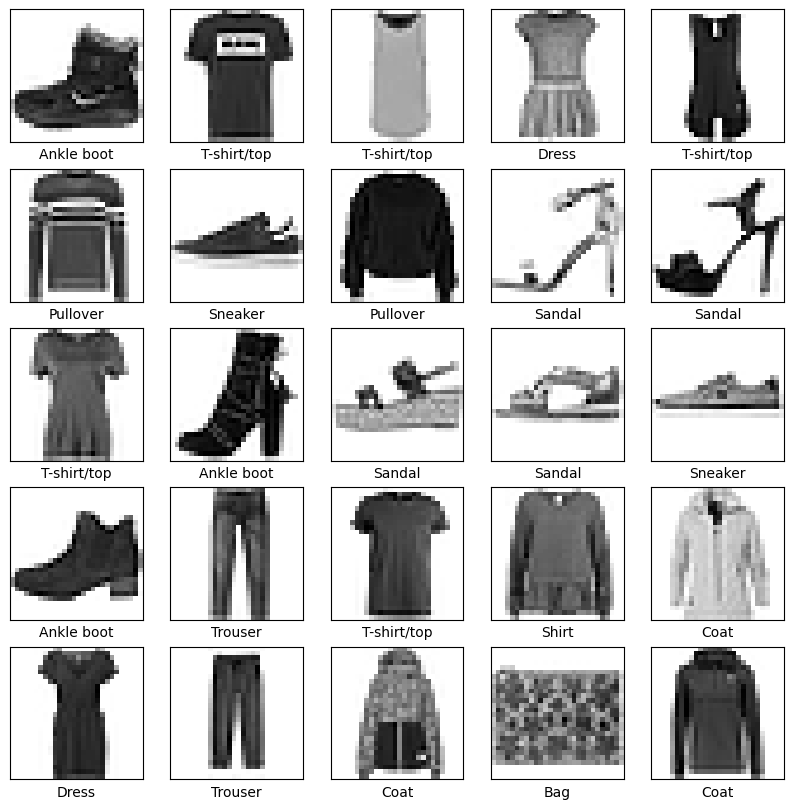
为了验证数据的格式是否正确,以及您是否已准备好构建和训练网络,让我们显示训练集中的前 25 个图像,并在每个图像下方显示类名称。
plt.figure(figsize=(10, 10))
for i in range(25):
    plt.subplot(5,5,i+1)
    plt.xticks([])
    plt.yticks([])
    plt.grid(False)
    plt.imshow(train_images[i], cmap=plt.cm.binary)
    plt.xlabel(class_names[train_labels[i]])
plt.show()
构建模型#
构建神经网络需要先配置模型的层,然后再编译模型。
设置层#
神经网络的基本组成部分是层。层会从向其馈送的数据中提取表示形式。希望这些表示形式有助于解决手头上的问题。
大多数深度学习都包括将简单的层链接在一起。大多数层(如 tensorflow.keras.layers.Dense)都具有在训练期间才会学习的参数。
model = tf.keras.Sequential([
    tf.keras.layers.Flatten(),
    tf.keras.layers.Dense(128, activation='relu'),
    tf.keras.layers.Dense(10)
])
该网络的第一层 tensorflow.keras.layers.Flatten 将图像格式从二维数组(28 x 28 像素)转换成一维数组(28 x 28 = 784 像素)。将该层视为图像中未堆叠的像素行并将其排列起来。该层没有要学习的参数,它只会重新格式化数据。
展平像素后,网络会包括两个 tensorflow.keras.layers.Dense 层的序列。它们是密集连接或全连接神经层。第一个 Dense 层有 128 个节点(或神经元)。第二个(也是最后一个)层会返回一个长度为 10 的 logits 数组。每个节点都包含一个得分,用来表示当前图像属于 10 个类中的哪一类。
编译模型#
在准备对模型进行训练之前,还需要再对其进行一些设置。以下内容是在模型的编译步骤中添加的:
损失函数 - 测量模型在训练期间的准确程度。你希望最小化此函数,以便将模型“引导”到正确的方向上。
优化器 - 决定模型如何根据其看到的数据和自身的损失函数进行更新。
指标 - 用于监控训练和测试步骤。以下示例使用了准确率,即被正确分类的图像的比率。
model.compile(optimizer='adam',
              loss=tf.keras.losses.SparseCategoricalCrossentropy(from_logits=True),
              metrics=['accuracy'])
训练模型#
训练神经网络模型需要执行以下步骤:
将训练数据馈送给模型。在本例中,训练数据位于
train_images和train_labels数组中。模型学习将图像和标签关联起来。
要求模型对测试集(在本例中为
test_images数组)进行预测。验证预测是否与
test_labels数组中的标签相匹配。
向模型馈送数据#
要开始训练,请调用 model.fit 方法,这样命名是因为该方法会将模型与训练数据进行“拟合”:
model.fit(train_images, train_labels, epochs=10)
Epoch 1/10
  74/1875 ━━━━━━━━━━━━━━━━━━━━ 3s 2ms/step - accuracy: 0.4871 - loss: 1.4441
1875/1875 ━━━━━━━━━━━━━━━━━━━━ 9s 2ms/step - accuracy: 0.7771 - loss: 0.6364
Epoch 2/10
1875/1875 ━━━━━━━━━━━━━━━━━━━━ 4s 2ms/step - accuracy: 0.8618 - loss: 0.3829
Epoch 3/10
1875/1875 ━━━━━━━━━━━━━━━━━━━━ 4s 2ms/step - accuracy: 0.8774 - loss: 0.3358
Epoch 4/10
1875/1875 ━━━━━━━━━━━━━━━━━━━━ 4s 2ms/step - accuracy: 0.8860 - loss: 0.3124
Epoch 5/10
1875/1875 ━━━━━━━━━━━━━━━━━━━━ 4s 2ms/step - accuracy: 0.8899 - loss: 0.2986
Epoch 6/10
1875/1875 ━━━━━━━━━━━━━━━━━━━━ 4s 2ms/step - accuracy: 0.8965 - loss: 0.2785
Epoch 7/10
1875/1875 ━━━━━━━━━━━━━━━━━━━━ 4s 2ms/step - accuracy: 0.9030 - loss: 0.2657
Epoch 8/10
1875/1875 ━━━━━━━━━━━━━━━━━━━━ 4s 2ms/step - accuracy: 0.9058 - loss: 0.2536
Epoch 9/10
1875/1875 ━━━━━━━━━━━━━━━━━━━━ 4s 2ms/step - accuracy: 0.9098 - loss: 0.2427
Epoch 10/10
1875/1875 ━━━━━━━━━━━━━━━━━━━━ 4s 2ms/step - accuracy: 0.9118 - loss: 0.2340
WARNING: All log messages before absl::InitializeLog() is called are written to STDERR
I0000 00:00:1729736509.779215 3208907 service.cc:146] XLA service 0x7f4dfc01b500 initialized for platform CUDA (this does not guarantee that XLA will be used). Devices:
I0000 00:00:1729736509.779287 3208907 service.cc:154]   StreamExecutor device (0): NVIDIA GeForce RTX 3090, Compute Capability 8.6
I0000 00:00:1729736509.779300 3208907 service.cc:154]   StreamExecutor device (1): NVIDIA GeForce RTX 2080 Ti, Compute Capability 7.5
I0000 00:00:1729736513.497273 3208907 device_compiler.h:188] Compiled cluster using XLA!  This line is logged at most once for the lifetime of the process.
<keras.src.callbacks.history.History at 0x7f518f49ec30>
在模型训练期间,会显示损失和准确率指标。此模型在训练数据上的准确率达到了 0.91(或 91%)左右。
评估准确率#
接下来,比较模型在测试数据集上的表现:
test_loss, test_acc = model.evaluate(test_images,  test_labels, verbose=2)

print('\nTest accuracy:', test_acc)
313/313 - 2s - 6ms/step - accuracy: 0.8796 - loss: 0.3494

Test accuracy: 0.8795999884605408
结果表明,模型在测试数据集上的准确率略低于训练数据集。训练准确率和测试准确率之间的差距代表过拟合。过拟合是指机器学习模型在新的、以前未曾见过的输入上的表现不如在训练数据上的表现。过拟合的模型会“记住”训练数据集中的噪声和细节,从而对模型在新数据上的表现产生负面影响。有关更多信息,请参阅以下内容:
进行预测#
模型经过训练后,您可以使用它对一些图像进行预测。附加一个 Softmax 层,将模型的线性输出 logits 转换成更容易理解的概率。
probability_model = tf.keras.Sequential([model,
                                         tf.keras.layers.Softmax()])
predictions = probability_model.predict(test_images)
313/313 ━━━━━━━━━━━━━━━━━━━━ 1s 3ms/step
在上例中,模型预测了测试集中每个图像的标签。我们来看看第一个预测结果:
predictions[0]
array([1.6527409e-08, 1.4129248e-09, 2.2416434e-10, 8.0054169e-10,
       3.7958323e-08, 8.9384953e-04, 2.1727022e-08, 1.2796247e-02,
       3.7120977e-08, 9.8630977e-01], dtype=float32)
预测结果是一个包含 10 个数字的数组。它们代表模型对 10 种不同服装中每种服装的“置信度”。您可以看到哪个标签的置信度值最大:
np.argmax(predictions[0])
9
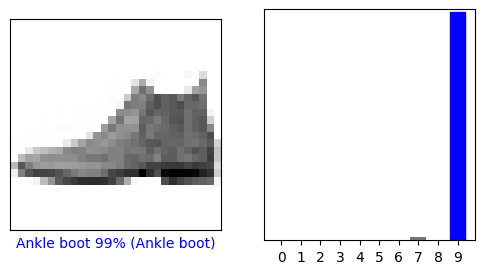
因此,该模型非常确信这个图像是短靴,或 class_names[9]。通过检查测试标签发现这个分类是正确的:
test_labels[0]
9
您可以将其绘制成图表,看看模型对于全部 10 个类的预测。
def plot_image(i, predictions_array, true_label, img):
  true_label, img = true_label[i], img[i]
  plt.grid(False)
  plt.xticks([])
  plt.yticks([])

  plt.imshow(img, cmap=plt.cm.binary)

  predicted_label = np.argmax(predictions_array)
  if predicted_label == true_label:
    color = 'blue'
  else:
    color = 'red'

  plt.xlabel("{} {:2.0f}% ({})".format(class_names[predicted_label],
                                100*np.max(predictions_array),
                                class_names[true_label]),
                                color=color)

def plot_value_array(i, predictions_array, true_label):
  true_label = true_label[i]
  plt.grid(False)
  plt.xticks(range(10))
  plt.yticks([])
  thisplot = plt.bar(range(10), predictions_array, color="#777777")
  plt.ylim([0, 1])
  predicted_label = np.argmax(predictions_array)

  thisplot[predicted_label].set_color('red')
  thisplot[true_label].set_color('blue')
验证预测结果#
在模型经过训练后,您可以使用它对一些图像进行预测。
我们来看看第 0 个图像、预测结果和预测数组。正确的预测标签为蓝色,错误的预测标签为红色。数字表示预测标签的百分比(总计为 100)。
i = 0
plt.figure(figsize=(6,3))
plt.subplot(1,2,1)
plot_image(i, predictions[i], test_labels, test_images)
plt.subplot(1,2,2)
plot_value_array(i, predictions[i],  test_labels)
plt.show()
i = 12
plt.figure(figsize=(6,3))
plt.subplot(1,2,1)
plot_image(i, predictions[i], test_labels, test_images)
plt.subplot(1,2,2)
plot_value_array(i, predictions[i],  test_labels)
plt.show()
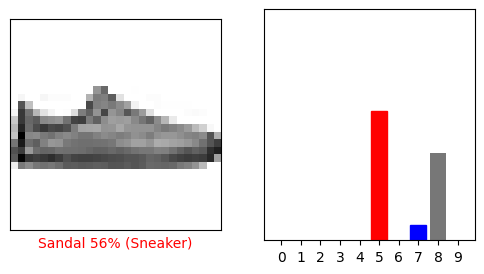
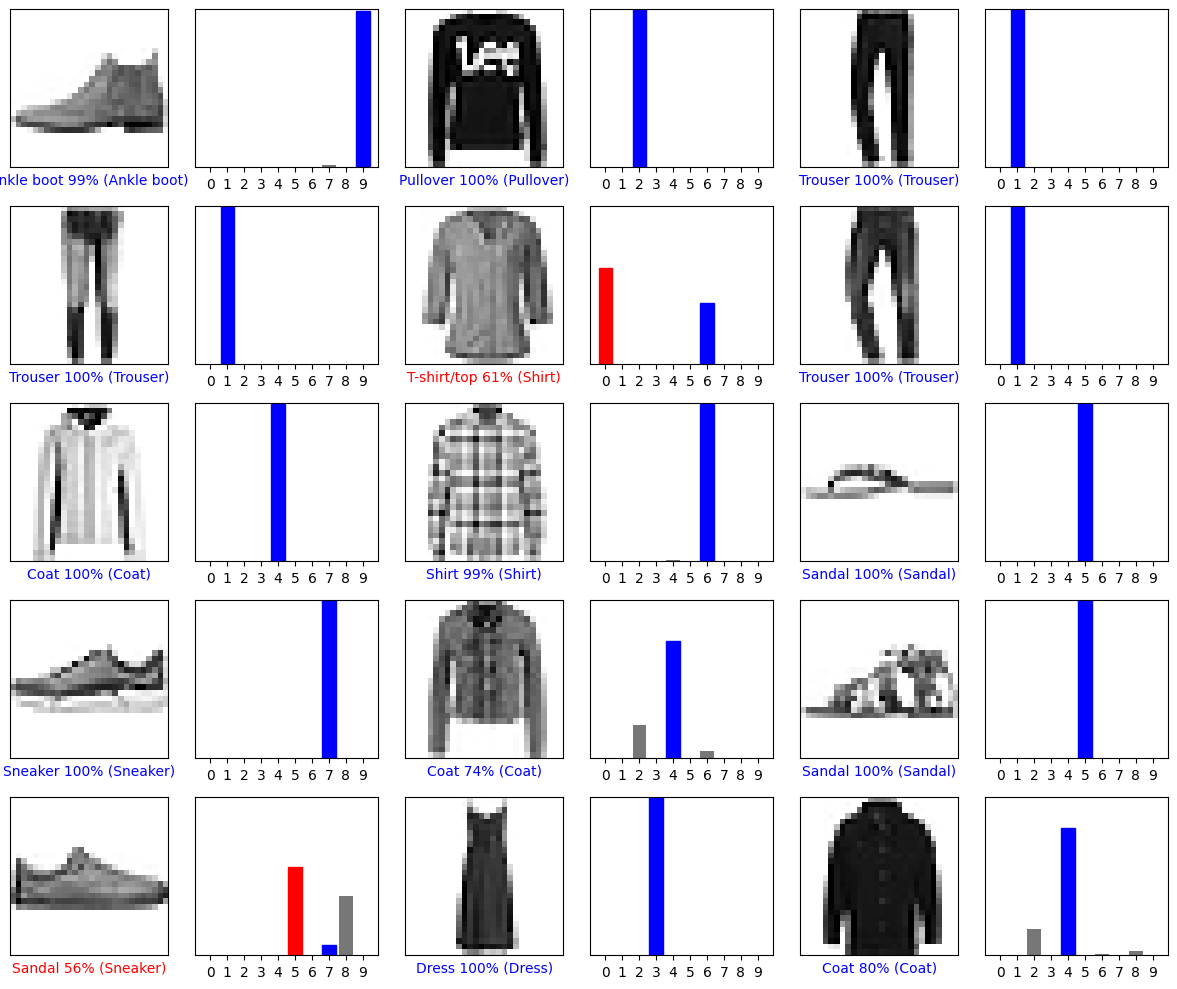
让我们用模型的预测绘制几张图像。请注意,即使置信度很高,模型也可能出错。
# Plot the first X test images, their predicted labels, and the true labels.
# Color correct predictions in blue and incorrect predictions in red.
num_rows = 5
num_cols = 3
num_images = num_rows*num_cols
plt.figure(figsize=(2*2*num_cols, 2*num_rows))
for i in range(num_images):
  plt.subplot(num_rows, 2*num_cols, 2*i+1)
  plot_image(i, predictions[i], test_labels, test_images)
  plt.subplot(num_rows, 2*num_cols, 2*i+2)
  plot_value_array(i, predictions[i], test_labels)
plt.tight_layout()
plt.show()
使用训练好的模型#
最后,使用训练好的模型对单个图像进行预测。
# Grab an image from the test dataset.
img = test_images[1]

print(img.shape)
(28, 28)
tf.keras 模型经过了优化,可同时对一个批或一组样本进行预测。因此,即便您只使用一个图像,您也需要将其添加到列表中:
# Add the image to a batch where it's the only member.
img = (np.expand_dims(img,0))

print(img.shape)
(1, 28, 28)
现在预测这个图像的正确标签:
predictions_single = probability_model.predict(img)

print(predictions_single)
1/1 ━━━━━━━━━━━━━━━━━━━━ 0s 143ms/step
[[3.28207592e-04 2.89583964e-11 9.99377131e-01 1.29967814e-10
  1.93019659e-04 2.80547027e-11 1.01659716e-04 2.54715407e-16
  1.74937620e-09 1.95157475e-12]]
plot_value_array(1, predictions_single[0], test_labels)
_ = plt.xticks(range(10), class_names, rotation=45)
plt.show()
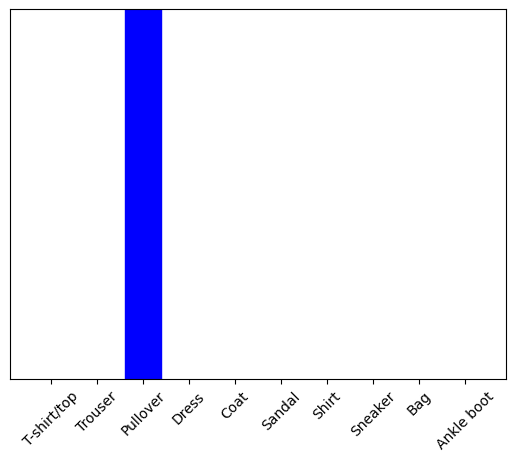
keras.Model.predict 会返回一组列表,每个列表对应一批数据中的每个图像。在批次中获取对我们(唯一)图像的预测:
np.argmax(predictions_single[0])
2
该模型会按照预期预测标签。


