折线图#
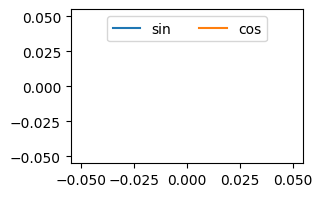
使用 pyplot 创建一个折线图。当与 ui.timer 结合使用时,push 方法可以提供实时更新。
n: 线条的数量limit: 每条线的最大数据点数(新点将替换最旧的点)update_every: 只有在推送新数据多次后才更新图表,以节省CPU和带宽close: 是否在退出上下文后关闭图形;如果你稍后想要更新它,请设置为False(默认:True)kwargs: 应该传递给pyplot.figure的参数,如 `figsize``
import math
from datetime import datetime
from nicegui import ui

line_plot = ui.line_plot(n=2, limit=20, figsize=(3, 2), update_every=5) \
    .with_legend(['sin', 'cos'], loc='upper center', ncol=2)

def update_line_plot() -> None:
    now = datetime.now()
    x = now.timestamp()
    y1 = math.sin(x)
    y2 = math.cos(x)
    line_plot.push([now], [[y1], [y2]])

line_updates = ui.timer(0.1, update_line_plot, active=False)
line_checkbox = ui.checkbox('active').bind_value(line_updates, 'active')

# ui.run()

